
LinkedIn Ads
Most of your buyers never click
They see you eleven times over four months, then type your name into Google and land as direct traffic. Pipefox counts the views, matches them to accounts, and puts the whole sequence next to the deal.
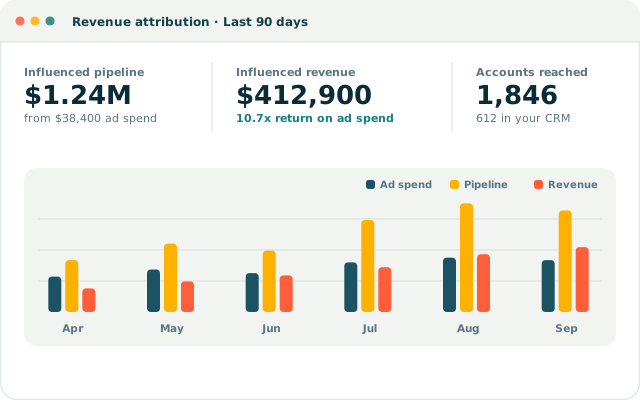
Revenue attribution
Pipefox lines up what you spent against the pipeline and revenue that spend touched. Not a modelled guess — the actual accounts, the actual deals, the actual amounts from your CRM.
Break it down by campaign, creative, audience or segment. Compare a month to the same month last year. Export the view your CFO keeps asking for.
Customer journeys
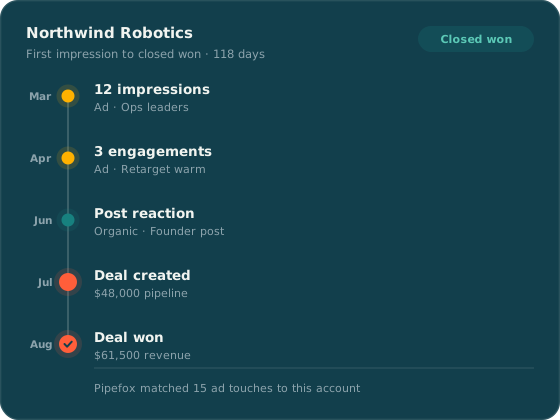
One account, one timeline. Every impression, click, reaction and comment in sequence, from the first time they saw you to the day the deal closed.
It answers the question every attribution debate stalls on: what did this company actually see before they showed up in our pipeline?
Optimisation
Three ways Pipefox gets your money back
Scheduling
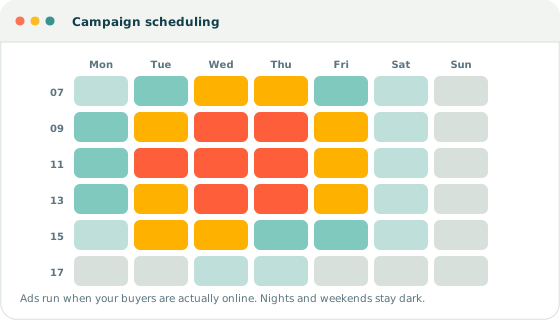
Pause delivery at nights and weekends, or whenever your audience is offline.
Impression caps
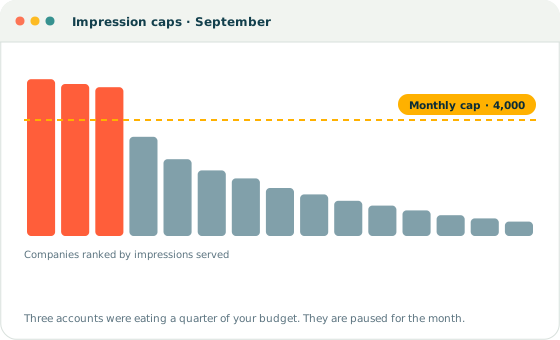
Set a monthly ceiling per company. Past it, the account is excluded until the month resets.
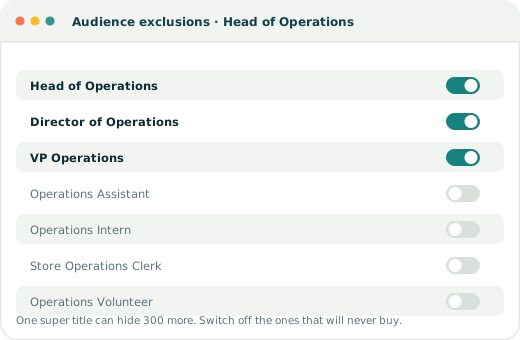
Title exclusions
Expand LinkedIn's super titles and switch off the hundreds you never meant to buy.
Implementing Pipefox took one afternoon. What surprised us was the view-through data — we uncovered nearly twice the influenced pipeline we had been reporting.

Attribution was a spreadsheet exercise for us. Now it is a tab I open on Monday morning and a number I trust in the board pack.

Ready to show where the pipeline came from?
Thirty days free. No card, no call, no implementation project.