
Benchmarks
Good, compared to whom?
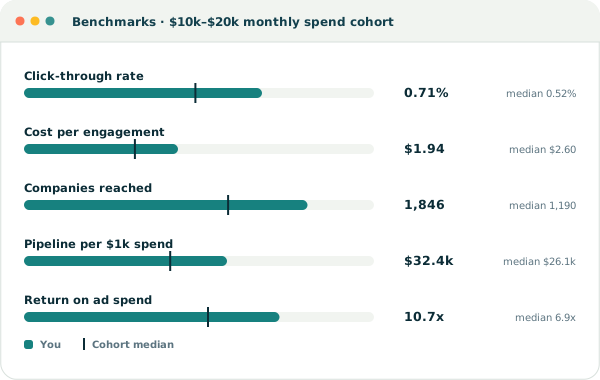
A 0.6% click-through rate means nothing on its own. We benchmark seven native metrics against teams spending what you spend.
Cohorts by spend, not by vibes
Results are split into four bands — under $10k a month, $10k to $20k, $20k to $50k, and $50k and above — because budget changes what good looks like more than industry does.
Metrics cover click-through rate, cost per engagement, companies reached, frequency, pipeline per thousand spent, cost per opportunity and return on ad spend.
How the data is built
Aggregated
Every number is pooled across hundreds of accounts. No individual advertiser is identifiable.
Refreshed monthly
Cohort medians move as the platform and the market move. Last year's numbers are not a target.
Opt-out any time
Contributing is on by default and can be switched off in settings without losing access.
Ready to show where the pipeline came from?
Thirty days free. No card, no call, no implementation project.